
IOHSAD OSH Incident Midyear Report (2026)
The Institute for Occupational Health and Safety Development (IOHSAD) monitors and documents occupational safety and health (OSH) incidents affecting Filipino workers nationwide, across both formal and informal sectors. The data presented in this report are compiled from news reports and accounts submitted directly by workers. It covers all cases recorded in the first half of 2026, logging the number of incidents, deaths, and injuries by month, cause, and industry. Its purpose is to identify patterns in workplace hazards and inform evidence-based OSH advocacy, policy recommendations, and worker protection programs.
Key Figures at a Glance
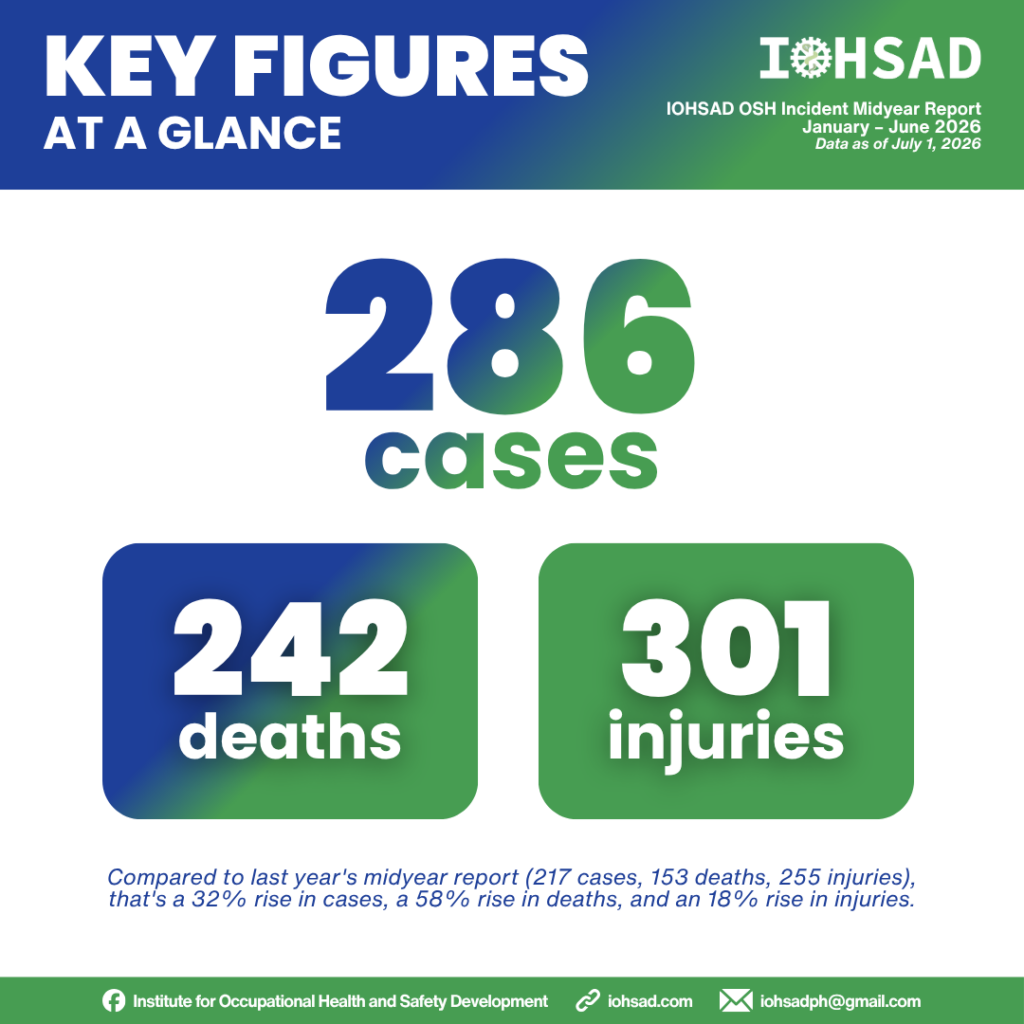
On average, more than one death and more than one injury were recorded for every OSH case documented across the semester.
Trends
Cases, deaths, and injuries fluctuated month to month but did not move in step with one another. The table below shows the full breakdown.
January was the deadliest month of the semester
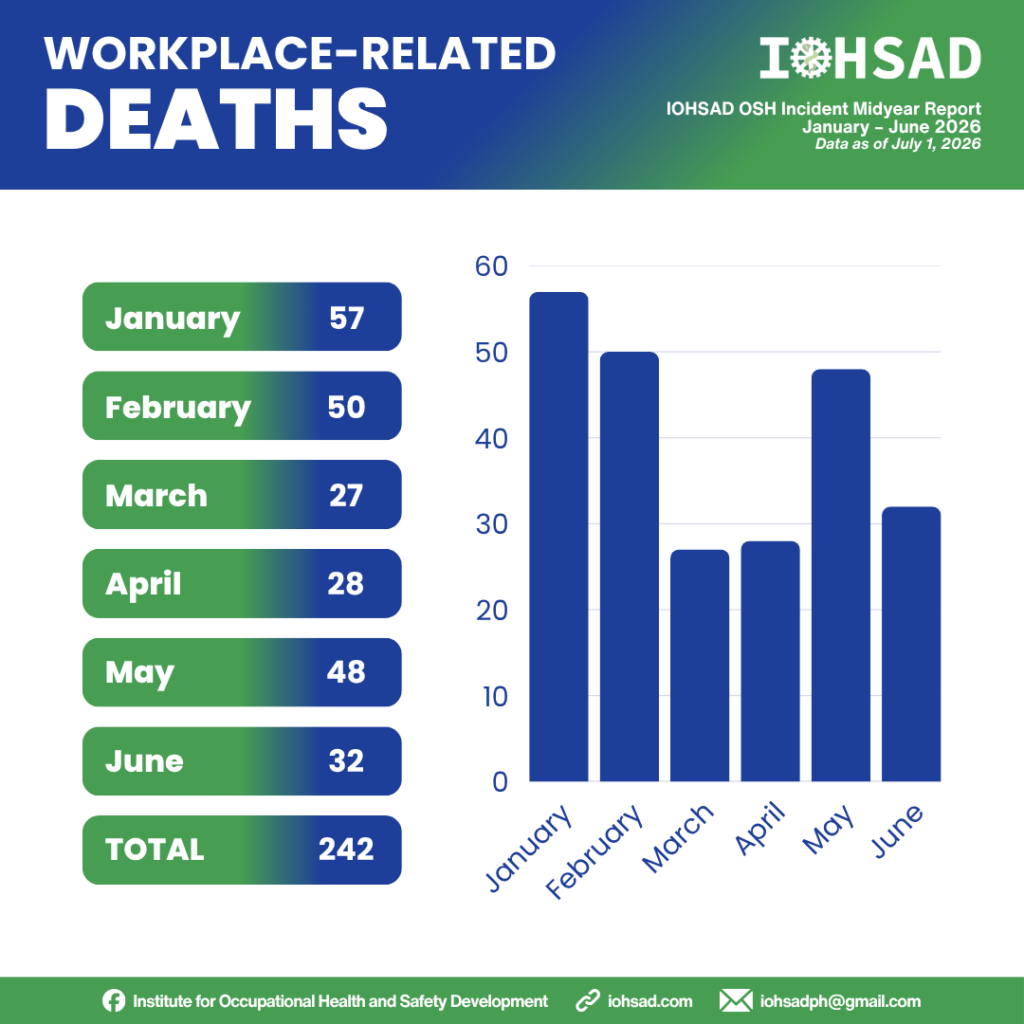
It recorded 57 deaths, the highest total of the six months, driven largely by a single catastrophic event: the Barangay Binaliw garbage landslide in Cebu City, which alone accounted for 39 confirmed deaths.
Cases peaked in April, but deaths did not
April logged the most cases (55), yet its death toll (28) was among the lowest of the semester. A busier month does not always mean a deadlier one; severity depends on the nature of the incidents, not just their number.
March was the calmest month overall
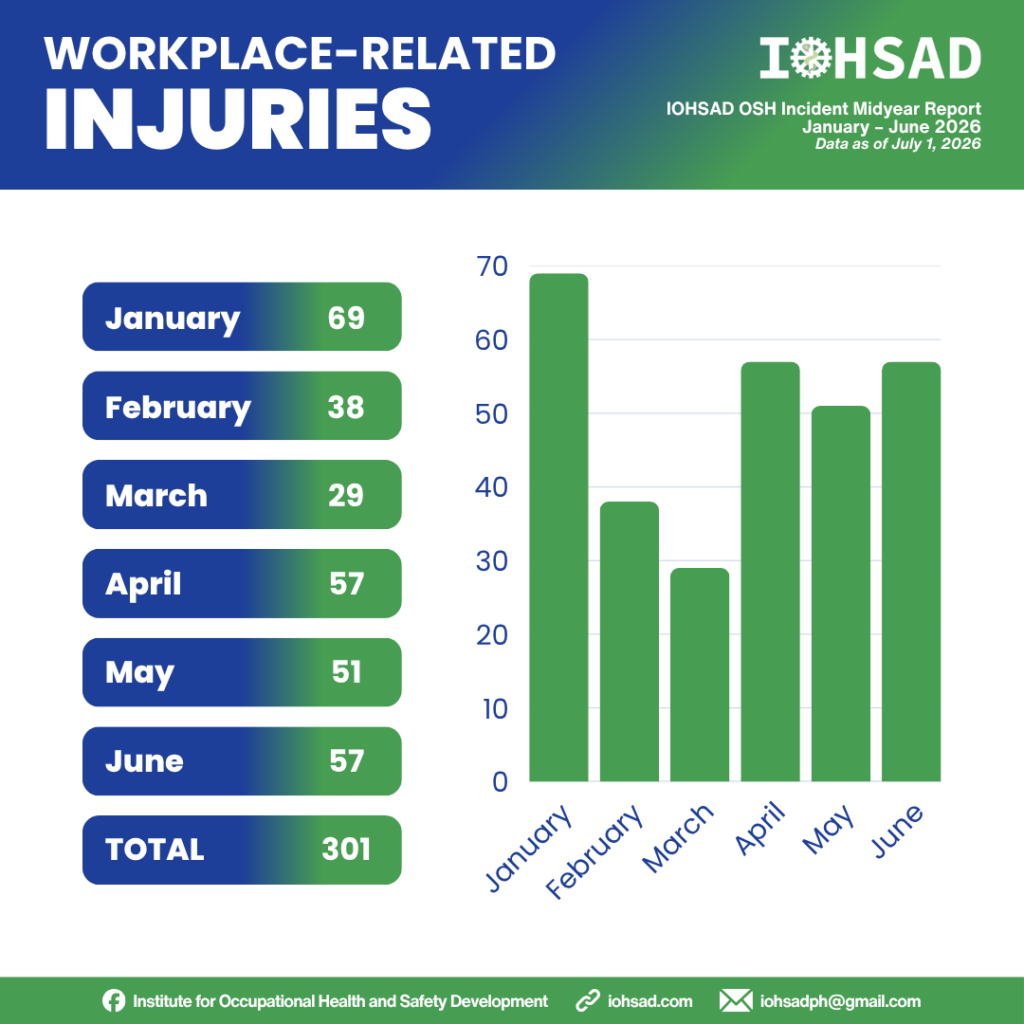
It recorded the lowest cases (39), deaths (27), and injuries (29) of the semester, the only month where all three indicators bottomed out together.
Injuries rebounded strongly from April onward
After dropping to 29 in March, injuries climbed back to 57 in April and stayed near 50 through May and June, mirroring a resurgence in road and workplace incidents in the second quarter.
Leading Causes of Incidents
Eleven causes were tracked across the semester. Road traffic injuries and violence and harassment together accounted for well over half of all recorded cases.
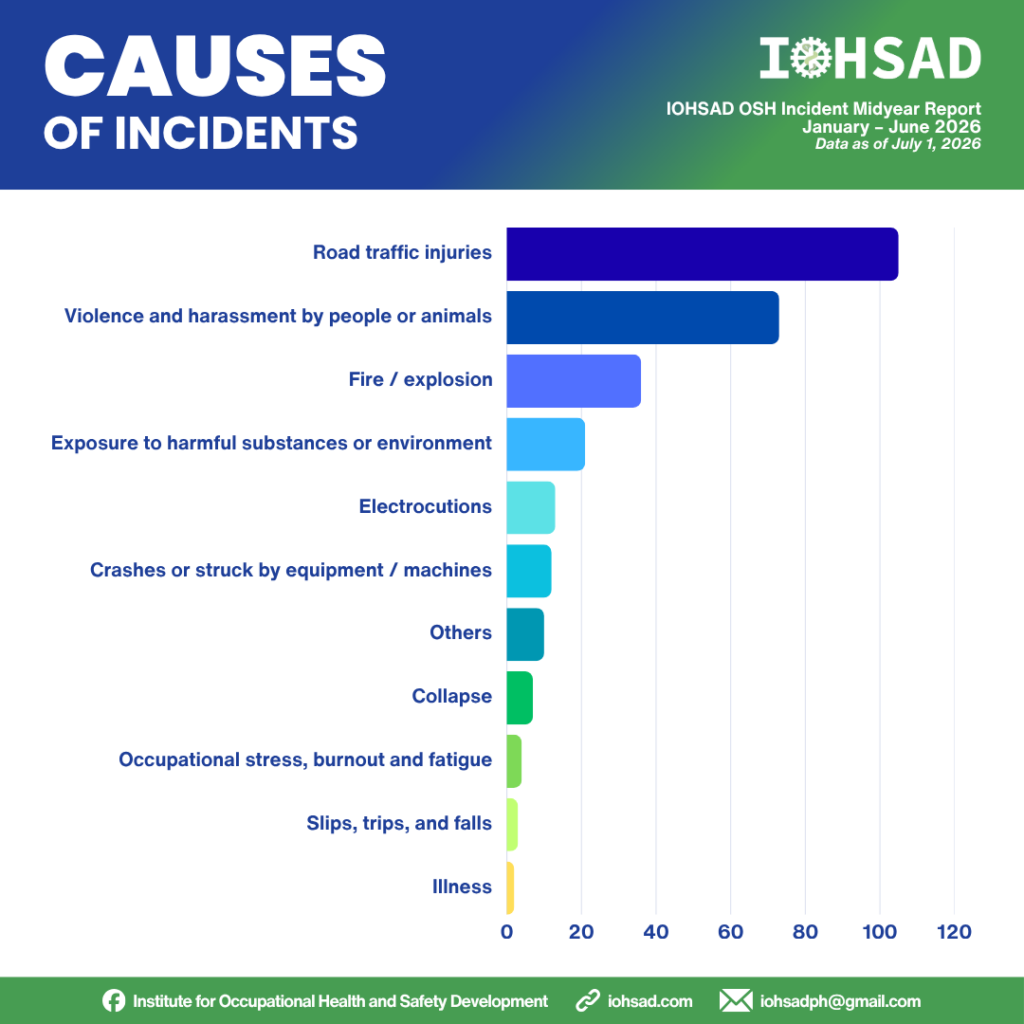
Road traffic injuries, 105 cases (36.7%)
This was the single leading cause of OSH incidents in every month of the semester. Monthly totals rose from 12 cases in January to a semester high of 24 in April, holding near that level through May with 23 cases. Common triggers included brake failure on trucks and buses, drivers falling asleep at the wheel, and overloaded or speeding vehicles. The burden fell heavily on delivery riders, tricycle and jeepney drivers, and truck helpers, the transport workforce most exposed to this cause.
Violence and harassment by people or animals, 73 cases (25.5%)
This was the second leading cause overall, and briefly overtook road traffic as the top cause in February, when 16 cases were recorded against 15 for road traffic. The most frequent victims were tricycle and delivery drivers, security guards, and barangay officials, workers whose jobs require regular public exposure. The category includes shootings, stabbings, ambushes, and workplace disputes that escalated into physical harm.
Fire and explosion, 36 cases (12.6%)
These incidents recurred in nearly every month, ranging from 4 cases in February to 9 in April. Warehouses, trucks, and buses were the most common sites, with incidents frequently traced to electrical short-circuits and overheating equipment.
Exposure to harmful substances or environment, 21 cases (7.3%)
This cause was concentrated early in the year: 10 of the 21 cases occurred in January alone, coinciding with rough seas and flooding that stranded fisherfolk and disabled boats.
The remaining causes recorded fewer cases each but still point to real hazards: electrocutions (13 cases), mostly among construction and utility workers contacting live wires; crashes or being struck by equipment (12 cases), workers hit by machinery, cranes, or falling cargo; miscellaneous incidents not fitting standard categories (10 cases); collapses (7 cases), including high-fatality building and landfill collapse events; occupational stress, burnout, and fatigue (4 cases), including teachers collapsing during duty; slips, trips, and falls (3 cases); and illness arising during or from work (2 cases).
Leading Causes of Incidents
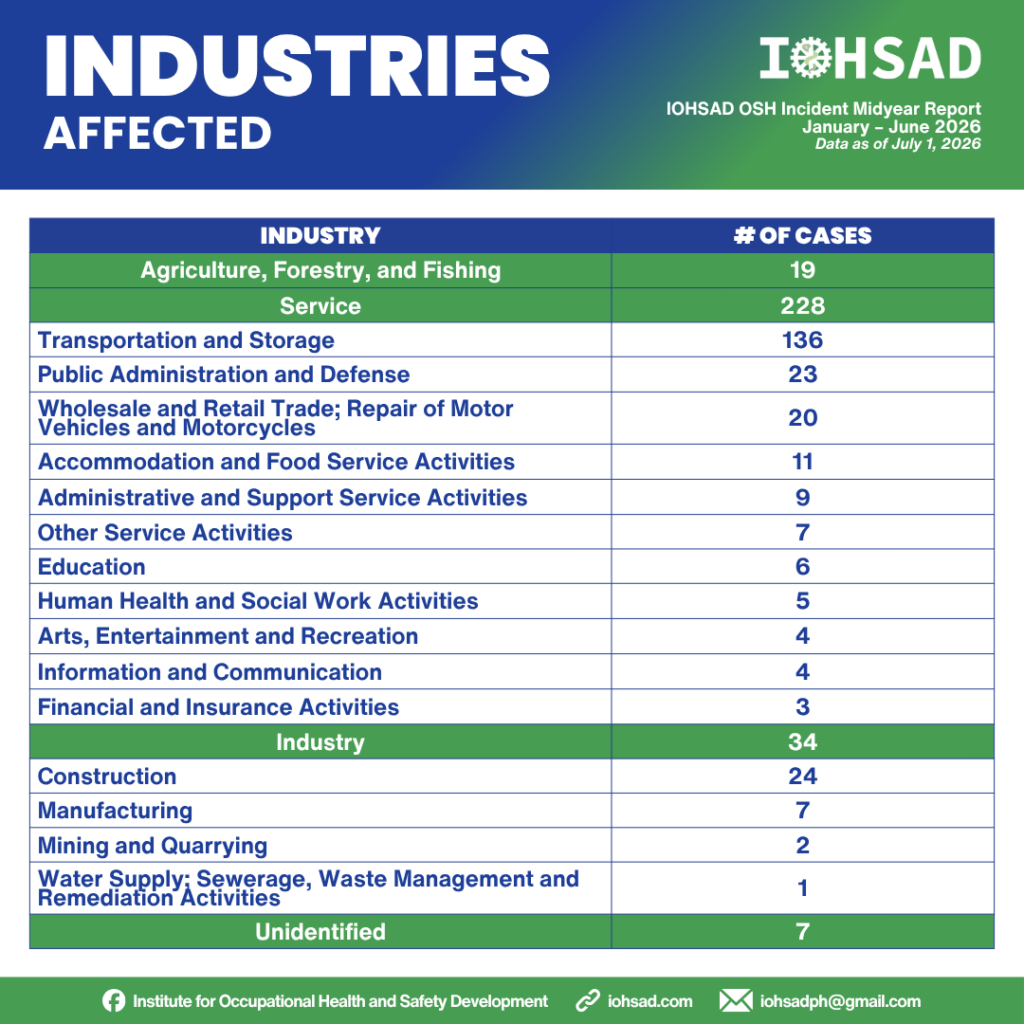
The service sector bore the overwhelming share of recorded cases, at 228 cases, or roughly 79% of the total. This sector spans transportation, public administration, retail, food service, and other frontline occupations. The industry sector, covering construction, manufacturing, mining, and utilities, accounted for 34 cases (about 12%), reflecting its physically hazardous work environments. Agriculture, forestry, and fishing accounted for 19 cases (about 7%), affecting fisherfolk lost at sea, farmers, and plantation workers. The industry of the worker could not be determined for 7 cases (about 2%).
Transportation and storage, 136 cases
Within the service sector, this was the single largest subsector, responsible for 136 cases, nearly half (47.6%) of all recorded OSH cases and 59.6% of all service-sector cases. This directly mirrors road traffic injuries being the leading overall cause, as truck, bus, jeepney, tricycle, and delivery-rider incidents dominate the sector, confirming that transport and logistics work carries the greatest OSH burden of any occupation tracked in this report.
Construction, 24 cases
Within the industry sector, construction was the leading subsector, with 24 cases making up 70.6% of all industry-sector cases. Workers faced collapsing scaffolding, wall and structure collapses, and electrocution from live wires, consistent with collapse and electrocution appearing among the report’s tracked causes.
Public administration and defense, 23 cases
Within the service sector, barangay officials, road workers, and other government personnel were frequent targets of violence or victims of road and workplace incidents while on duty.
Conclusion
Four patterns stand out from the first half of 2026 and should anchor IOHSAD’s advocacy going forward.
1. Road transport is the greatest OSH risk area
Road traffic injuries were the top cause of incidents (105 cases, 36.7%), and transportation and storage was the top industry (136 cases, 47.6%). These two findings reinforce each other and point to the same workforce: drivers, riders, and helpers.
2. Violence against workers is a close second concern
At 73 cases (25.5%), violence and harassment even overtook road traffic as February’s leading cause. This is not a minor or occasional risk but a persistent one, especially for drivers, guards, and public officials.
3. A few catastrophic events can define a month’s toll
Mass-casualty incidents, including the Binaliw landslide and the Pampanga building collapse (30 deaths), show that single disasters, not just the volume of cases, can drive monthly death counts sharply higher.
4. Construction remains a high-hazard workplace
Construction made up over 70% of industry-sector cases, consistently tied to collapse and electrocution incidents throughout the semester.
Recommendations
• Strengthen road safety compliance and vehicle maintenance standards for the transport and logistics sector, the workforce most affected this semester.
• Expand protection mechanisms against violence and harassment for frontline and public-facing workers, including drivers, security personnel, and local government employees.
• Reinforce occupational safety enforcement at construction sites, particularly around collapse and electrocution hazards.
• Pass House Bill (HB) 5221, amending Republic Act (RA) 11058, to criminalize OSH standards violations.
• Sustain continuous monitoring and public reporting of OSH incidents to support evidence-based advocacy and policy reform.